When it comes to PageSpeed Insights, it’s easy to misinterpret the data and focus on the wrong areas for improvement. For example, did you know that a WordPress site with a score in the mid 60s could technically pass Core Web Vitals? Being hyper-focused on that total score might actually be hurting you. In this article, we’ll discuss some of the mistakes we see clients making and why it’s important to understand the differences between real user data and lab data.
Real user data versus lab data
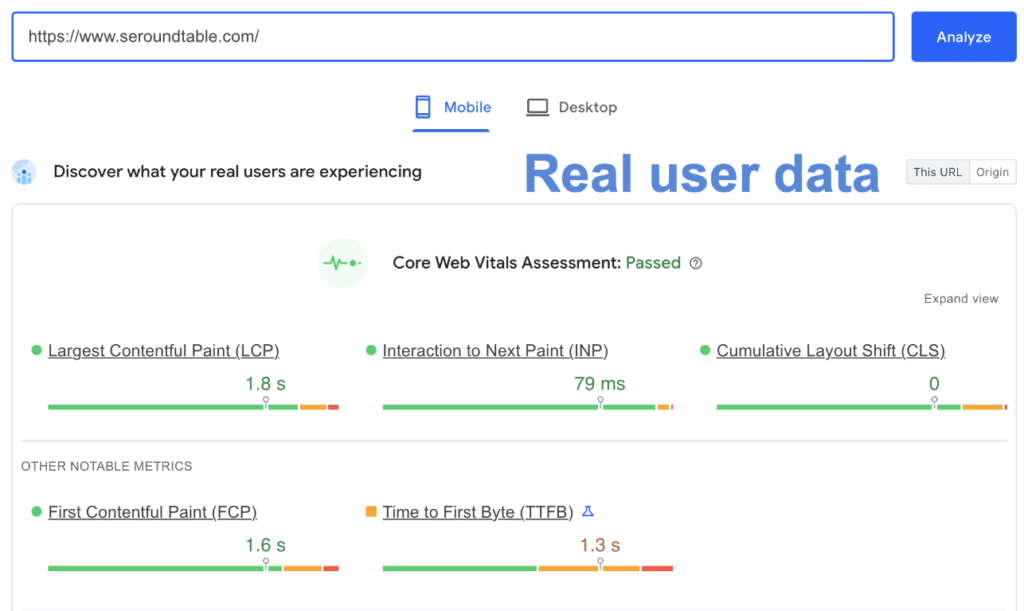
There are two parts to each PageSpeed Insights report. You have your real user data at the top, and you have your lab data at the bottom. Let’s take a look at this example site.
Real user data (top of the report)
The top half of the PageSpeed Insights report shows real user data collected over an average of 28 days. The data comes from the Chrome User Experience Report (CrUX), is collected from real browsers around the world, and reflects how Chrome users experience the site. This is what is officially used to determine whether you pass or fail Core Web Vitals metrics.
Important: If you don’t have enough traffic, you won’t see any data in this section.

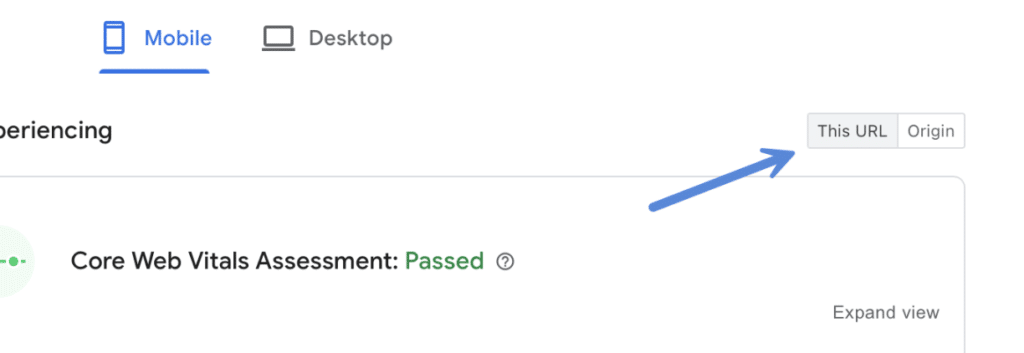
Make sure to also pay attention to this tab to see if there is enough data for your individual URL. Otherwise, it shows the data for the origin. The origin means the average of the real user data across your entire site. When troubleshooting and optimizing performance, knowing that your viewing the data for a specific URL or the entire site average is very important.

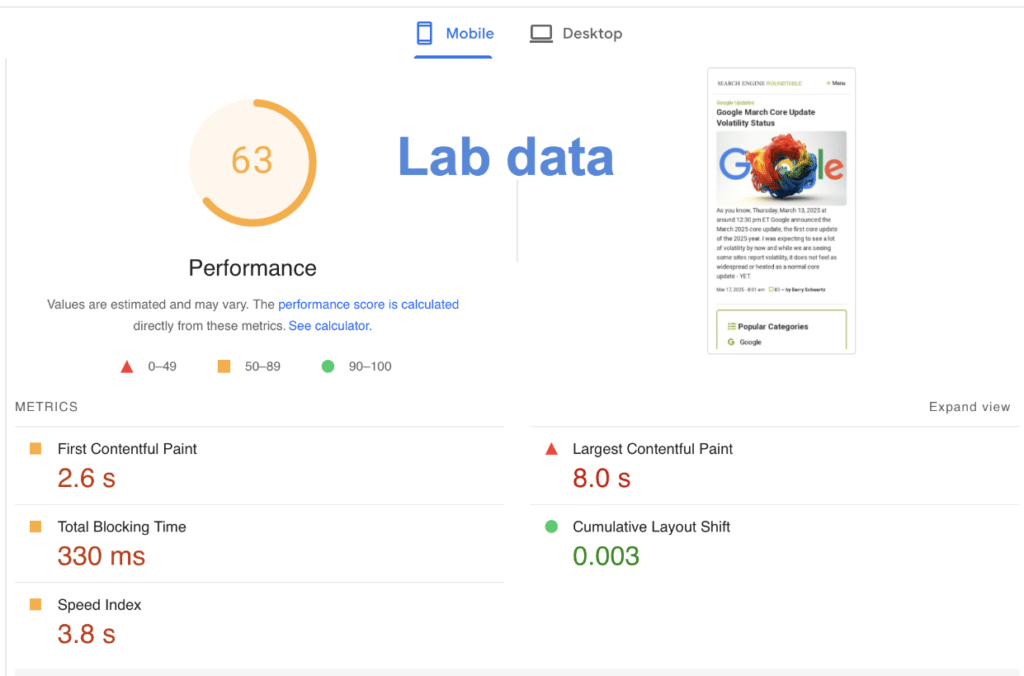
Lab data (bottom of the report)
The bottom half of the PageSpeed Insights report shows your lab data. This is the live data being emulated using a virtual device to show you opportunities for improvement on your site. It’s powered by Lighthouse.
Before analyzing the lab data, we always recommend testing at least three times. This is due to any factors that might influence the data in your first test. Things like cache, network latency, etc., Never just rely on one data point.

It’s very important to understand that this data is heavily throttled using a slow 4G mobile device. You’ll notice in the example above the total lab data score is 63, and yet they are actually passing Core Web Vitals for the URL. There could be a couple of reasons for this:
- The devices actually hitting the site in the real world are using faster connections, and therefore, the site actually loads faster. For example, you can see the overall LCP for the URL in terms of real user data is an average of 1.8 seconds. Whereas the lab data shows an LCP of 8 seconds.
- The real user data is an average taken, meaning it’s OK to have spikes here and there. It could be at this very moment, they have higher LCP, but over time, their LCP is actually much better. The real user data is delayed on collection, so it will rarely match the lab data.
Other important things to consider:
When running a lab test, the emulation happens at one of the following four PageSpeed Insight server locations (whichever one is physically closest to you):
- Northwestern US (Oregon)
- Southeastern US (South Carolina)
- Northwestern Europe (Netherlands)
- Asia (Taiwan)

This means a test run in the United States could vary from a test run in Europe, as FCP, LCP, etc., are impacted by server response time. However, the real user data would more accurately reflect where people are actually visiting your site from. This is why you should always host your site on a server close to the bulk of where your visitors or customers are located, even if you’re using edge cache (because cache expires).
Remember that Core Web Vitals comprises only three metrics: LCP, INP, and CLS. The other metrics are simply there to help you improve these.
Because of the reasons above, you can see why it might not matter as much to be hyperfocused solely on the total lab score. The lab data isn’t used by Core Web Vitals or Google. The real user data is really what matters. With that being said, the warnings (diagnostics) underneath the lab data in PageSpeed Insights should be used as opportunities to fix bigger issues, which then translate to a better and faster user experience over time (real user data).
We developed our Perfmatters plugin to help fix and improve those opportunities to then translate to better real user data for your WordPress site.
Additional tips
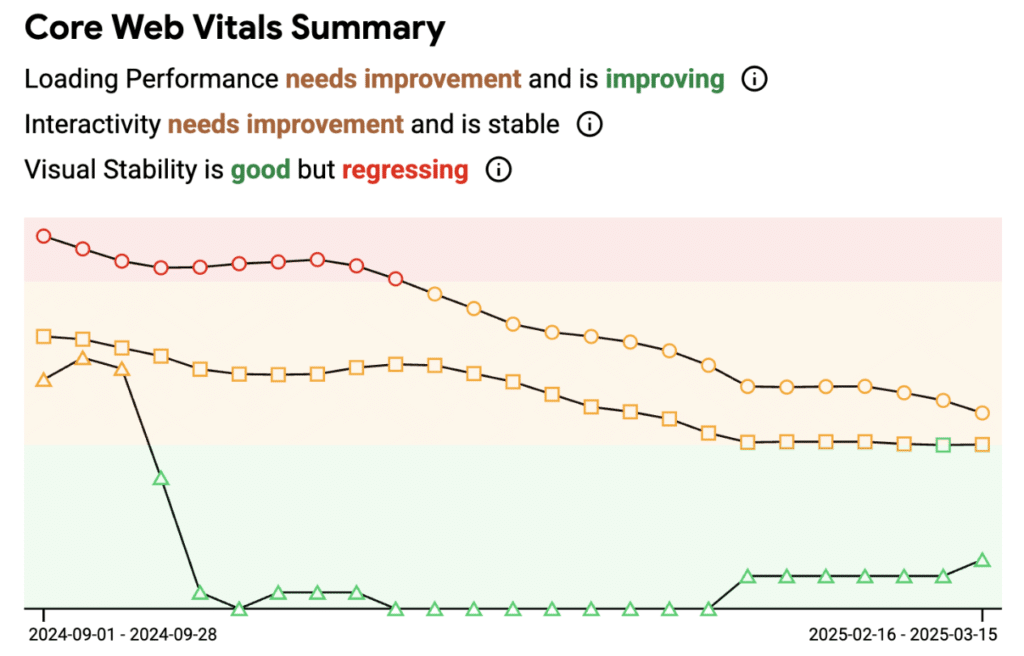
You can use Google Search Console to monitor your scores over a period of time. This is a good way to ensure you are making progress on your optimizations. The team at Google also created the CrUX Vis tool, which is super handy.
