Largest Contentful Paint (LCP) is a Core Web Vitals metric that gauges how fast the main content (largest) of a web page loads and becomes visible to users (in the viewport/above the fold). LCP is commonly an image (featured image on a blog post, background hero image), but can also be text (header) or video element.
Why is it important? A fast LCP means users see what is most likely one of the most important pieces of content or text above the fold right away. This leads to better user experience and perceived performance (how fast a site feels). Therefore, Google and Core Web Vitals put a big emphasis on optimizing the LCP on your WordPress site.
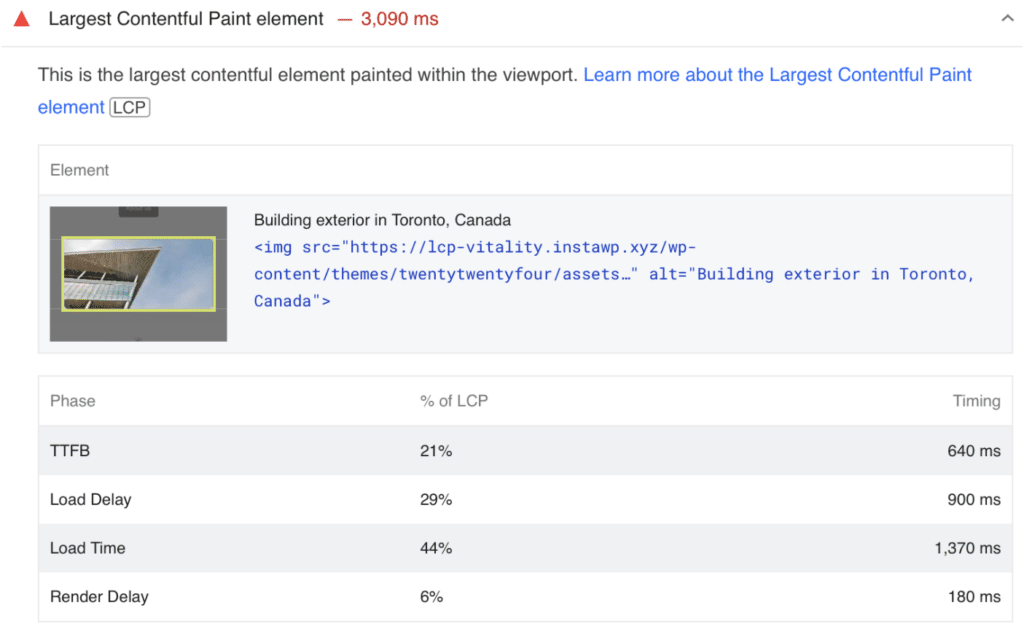
Below we’ll take a deep dive into better understanding LCP, measuring it, and how you can optimize it.
What is good LCP?
To meet the threshold for Google, LCP needs to occur within 2.5 seconds after the page first starts loading. If you’re under that, you’ll be “good” and in the green. Google will flag anything between 2.5 seconds and 4 seconds as “needs improvement” and over 4 seconds as “poor.”
They use the 75th percentile to determine where you stand. 75% of the visits/crawls need to meet the “good” threshold for you to get that classification.
You really want to aim for lower than 2.5 seconds because Google uses a throttled 4G connection for mobile when crawling your site. They are purposely measuring your site using a slow connection to ensure users across the board have a good experience, not just those on a fast connection.

How to measure LCP
There are many different tools you can use to measure LCP. Here are a few of our favorites that we use on a regular basis:
PageSpeed Insights
- Free
- You can quickly check how long it takes for your LCP element to load. Remember, this isn’t necessarily a warning, but rather a measurement that you should try improving.

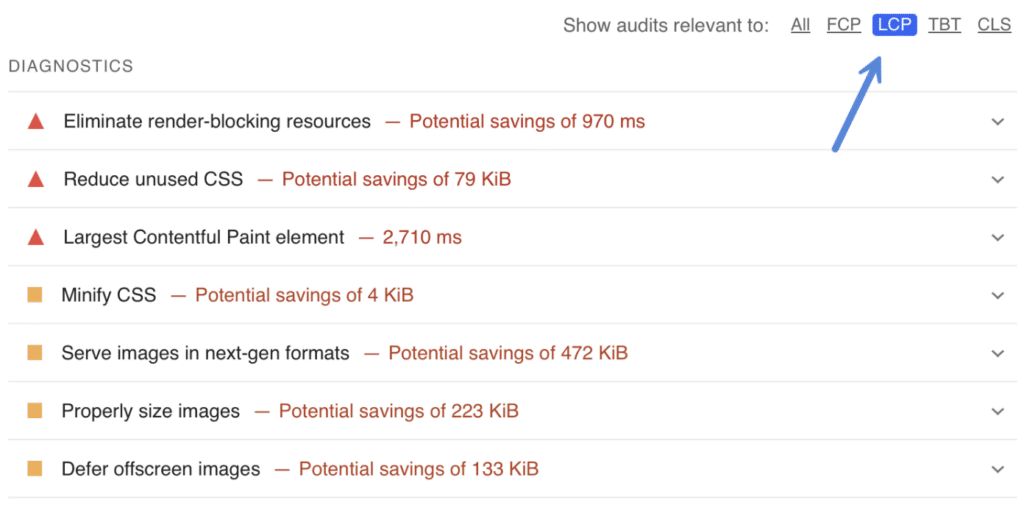
- We also like using the “filters” in PageSpeed Insights to easily see everything impacting the overall LCP time. Remember, there is the LCP element itself that can be optimized, as well as everything else that affects it (which we’ll dive into below).
DebugBear
- Free and premium
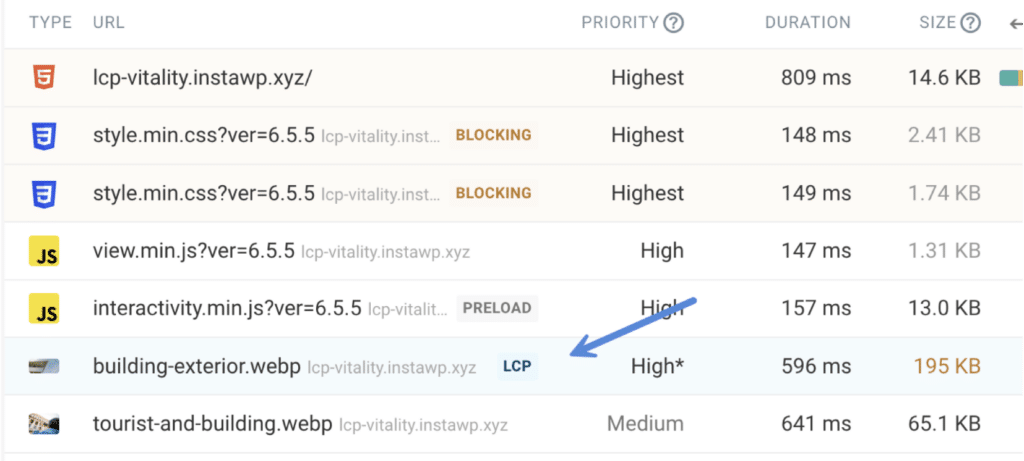
- We really like DebugBear because it has labels for attributes like LCP, preloads, etc. These labels can come in handy when fine-tuning.
GTmetrix
- Free with limits, premium.
- You can’t go wrong with GTmetrix. It has a very easy-to-understand UI.
WebPageTest
- Free with generous limits, premium.
We always recommend testing at least three times before looking at the data. This is due to any factors that might influence LCP in your first test. Things like cache, network latency, etc., Never just rely on one data point.
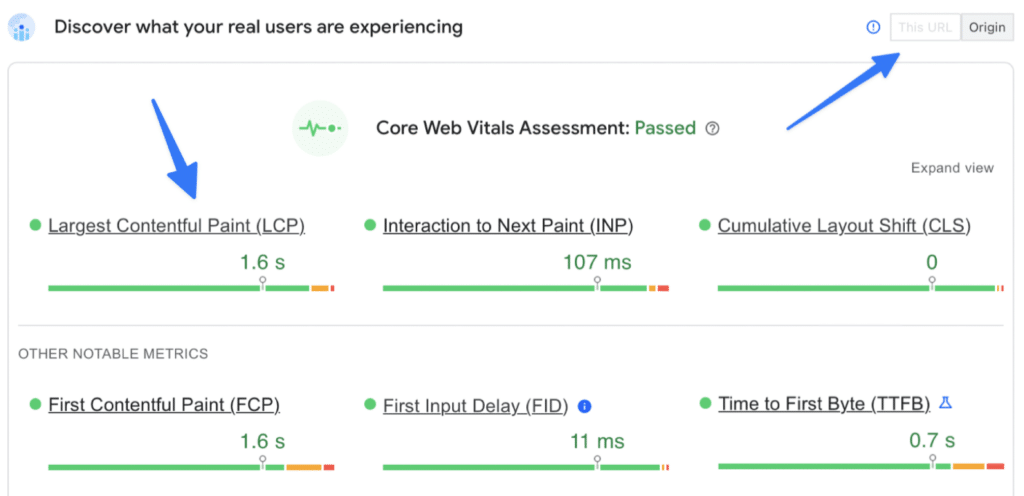
It’s important to understand the difference between lab data and real-user data. Lab data is at the bottom of the report under the “Diagnose performance issues” section. This top section is real-user data. It’s collected over an average of 28 days as users hit your site and are recorded for Core Web Vitals. Or rather, they are the only metrics that really matter. But remember, it’s always delayed.
Also, pay attention to this tab to see if there is enough data for your individual URL. Otherwise, the origin (average) of your site is shown.
Reduce server response time (TTFB)
One of the most important factors to improve LCP is having low TTFB. We highly recommend going through our in-depth article on how to reduce server response time which covers everything you need to know about TTFB and squeezing out as much performance as possible. Here is a quick summary of some of the important points:
- Using a high-quality hosting provider (powerful servers, networking, DNS, etc.). Check out our WordPress hosting recommendations.
- Use the latest version of PHP (or one behind). PHP 8.3 is ~10% faster than 8.1 (source).
- Reduce HTML size with a lightweight WordPress theme: GeneratePress, Kadence/Kadence Blocks, or Bricks.
- External files are generally better for LCP, so don’t just inline everything. The smaller the HTML size, the faster the LCP can be reached and painted. We have a “File” method for our Remove Unused CSS feature in Perfmatters. Many other solutions like GeneratePress, Bricks, and WS Form have options to use external files. We’ve seen decreases in LCP of over 25% just by reducing the amount of inline code.
- Have a cache solution in place (server-level, plugin).
- When enabling cache on a server in the same geographical location: LCP decrease of 20.67%.
- Preload or warm the cache.
- Utilize edge cache if you’re serving global visitors (Cloudflare).
- Without edge cache: LCP increase of 140.1%.
Enable text compression
Compression is a method of reducing the size of data without losing any information. Think of it like image optimization, but for HTML and CSS/JS.
Hosting providers, CDNs (Cloudflare), and cache plugins typically should add compression headers automatically for gzip or Brotli (latest method). However, we still see this missing all the time, many times due to a misconfiguration with hosting or cache.
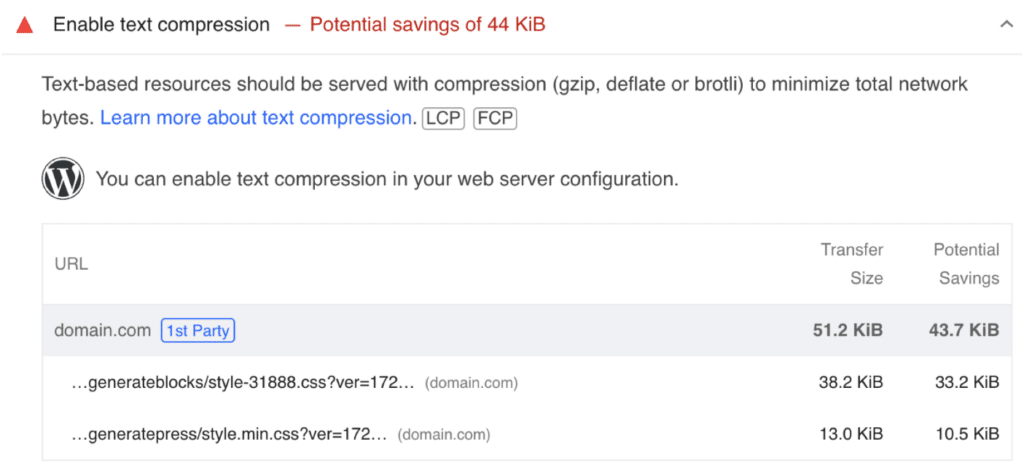
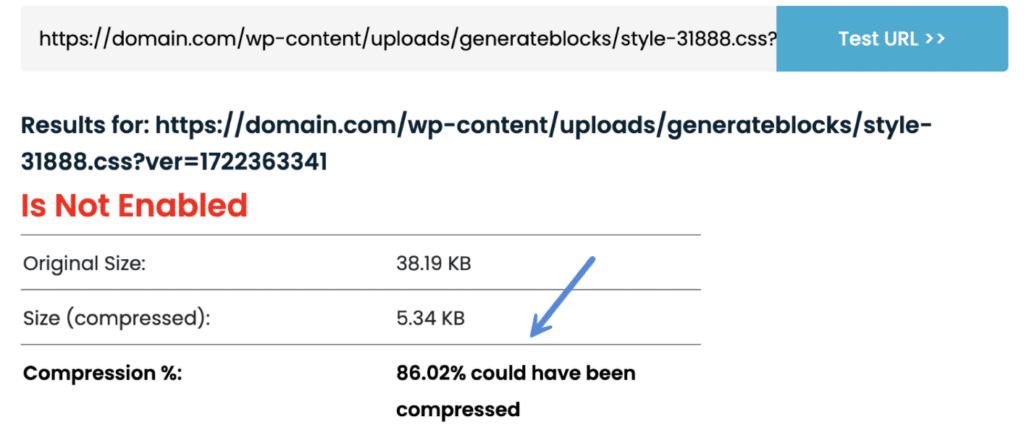
If you see this warning, make it a top priority to fix it, as compression has a huge impact on performance. In the example below, you can see there is a 86.02% savings on a single file just by enabling compression. You can use a third-party tool like GiftOfSpeed to verify that you have it enabled. We’ve seen instances where some assets are compressed (typically dynamically generated resources), and others aren’t. It’s not always an all-or-nothing problem.
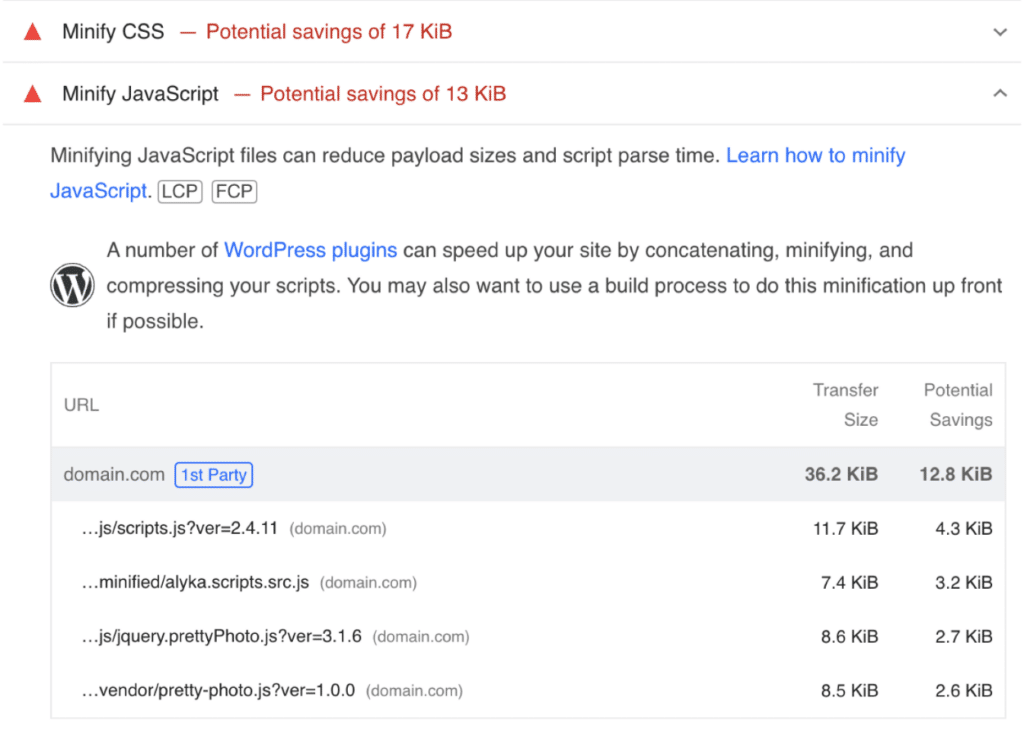
Minify JS and CSS
Next, we are going to start with some of the easiest things you can do to improve LCP using our Perfmatters plugin. The first is to enable JS and CSS minification. This is the process of removing unnecessary characters from your code (whitespace, comments, shortening function and variable names, etc.), along with additional markup cleanup.
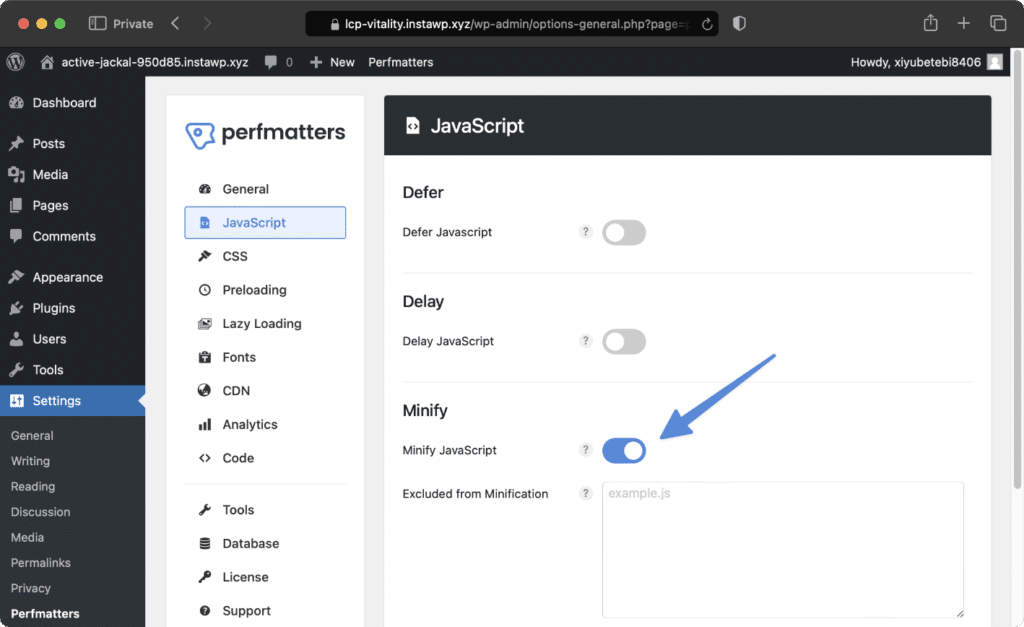
- Enable JS minification in Perfmatters.
- Enable CSS minification in Perfmatters.
Files with .min.js or .min.css are automatically skipped, so this feature is very lightweight and fast. We also have exclusions and filters for fine-tuning minification if needed. However, minification rarely needs any changes.
Reduce unused CSS
Next, we have unused CSS. Many themes and plugins simply load their entire stylesheets everywhere. Because of this, you’ll have a lot of unused code.
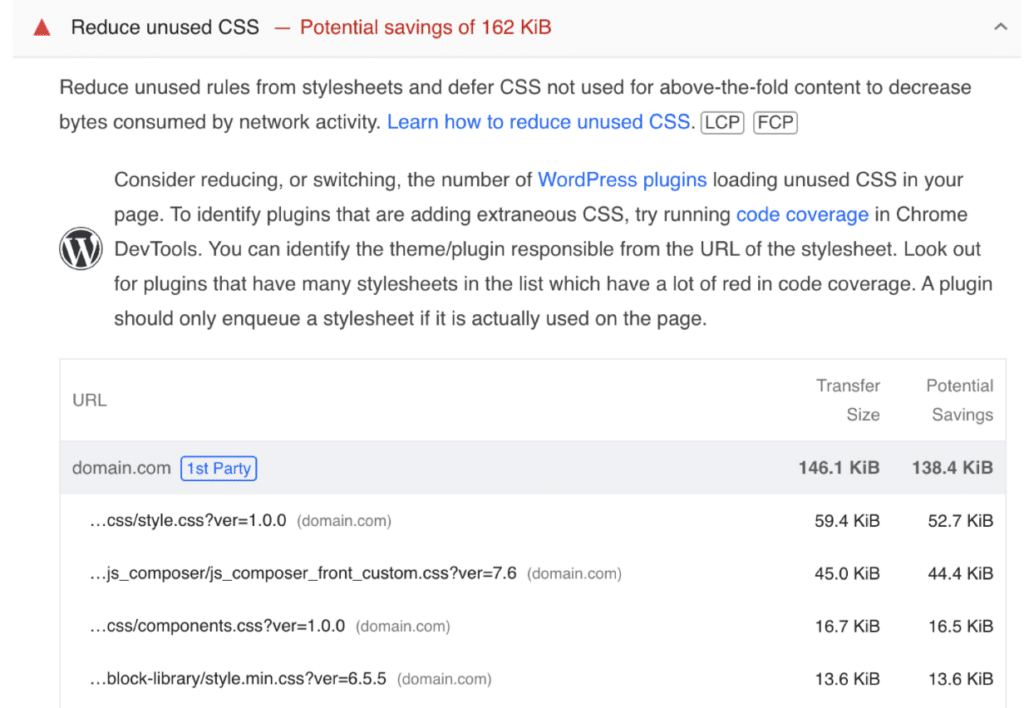
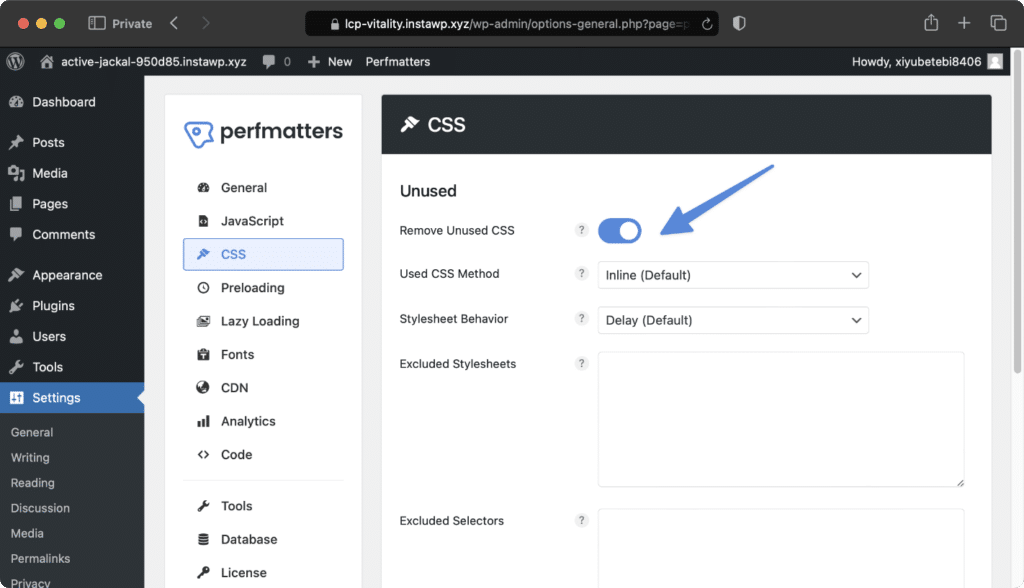
You can clean this up using the Remove Unused CSS feature in our Perfmatters plugin. In our testing across hundreds of sites, we’ve seen an average decrease in LCP of 19.66%.
We have exclusions and filters for fine-tuning things if needed.
Reduce unused JavaScript
Next, we have unused JavaScript. Like with unused CSS, many themes and plugins simply load their JS everywhere. Same with third-party scripts. Because of this, you might have a lot of unused code that doesn’t necessarily need to load right away.
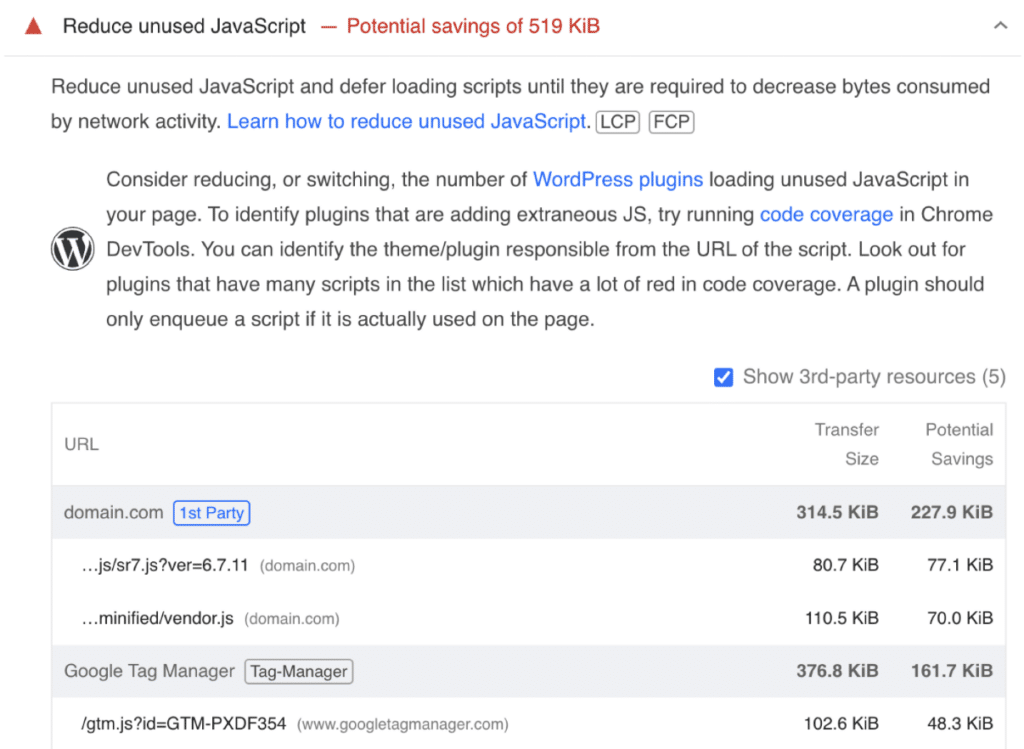
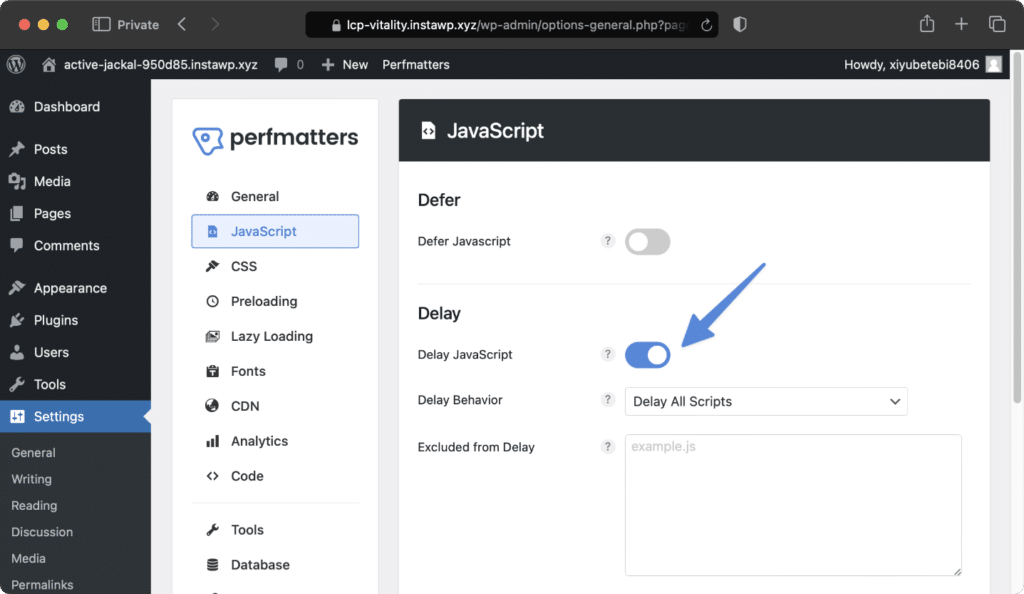
You can use the Delay JavaScript feature in our Perfmatters plugin to delay scripts not needed right away based on user interaction (scrolling, moving mouse, touch on mobile, etc.). We have exclusions, quick exclusions, and filters for fine-tuning things.
Eliminate render-blocking resources
The next thing you can do is to fix any render-blocking resources. Most CSS and JavaScript are naturally render-blocking. There are a couple of ways you can fix this.
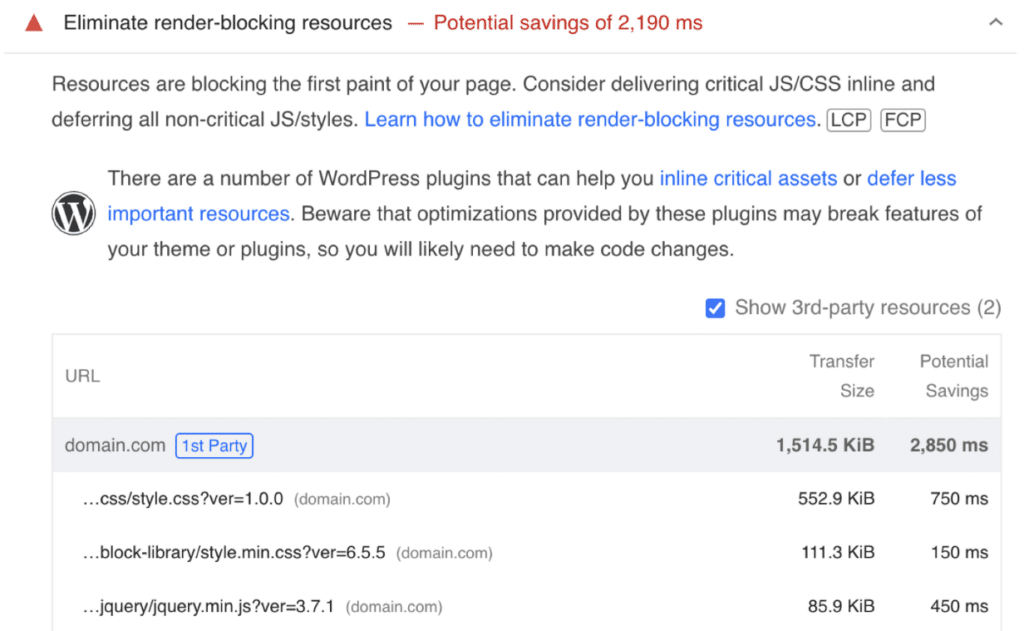
First off, using the Remove Unused CSS and Delay JS features above will automatically fix the render-blocking issues on those assets. That’s why we recommend focusing on unused CSS and JS first.
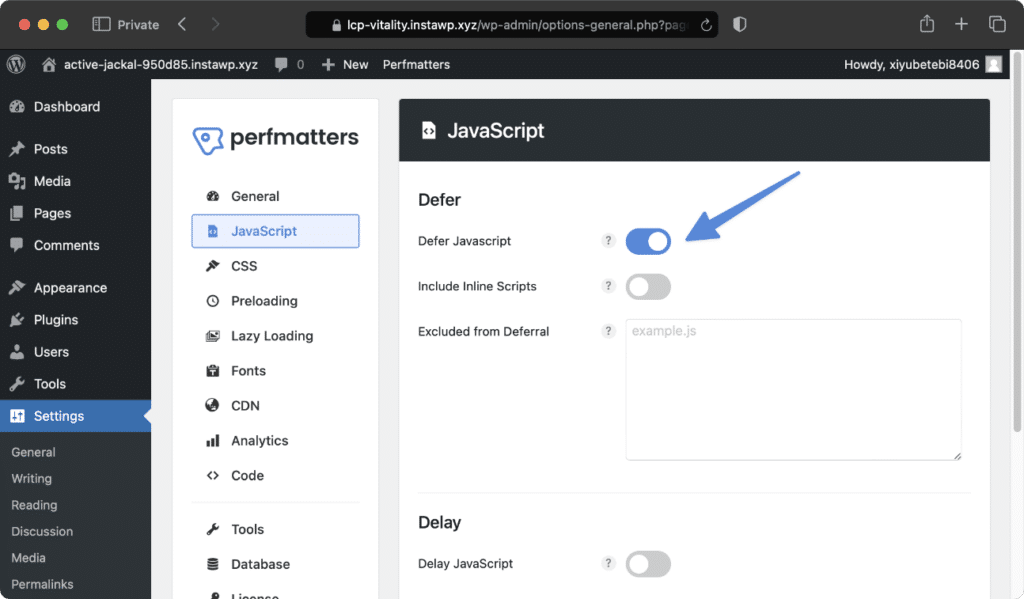
Second, you can defer JavaScript in our Perfmatters plugin. JS is downloaded during HTML parsing and will execute after the page has finished loading. Any JavaScript that isn’t delayed will automatically get deferred, so you can use both features simultaneously. And we have exclusions and filters for fine-tuning things.
It’s also important to note that on many sites, jQuery can’t be optimized. Although we do have advanced options to defer jQuery when possible, and it can be delayed if a theme or plugin doesn’t need it loading right away.
Ensure text remains visible during webfont load
Next is the “ensure text remains visible during webfont load” warning. Modern browsers wait until the font has fully downloaded to display it. This can create a flash of invisible text, otherwise known as FOIT. That also means it could hold up LCP.
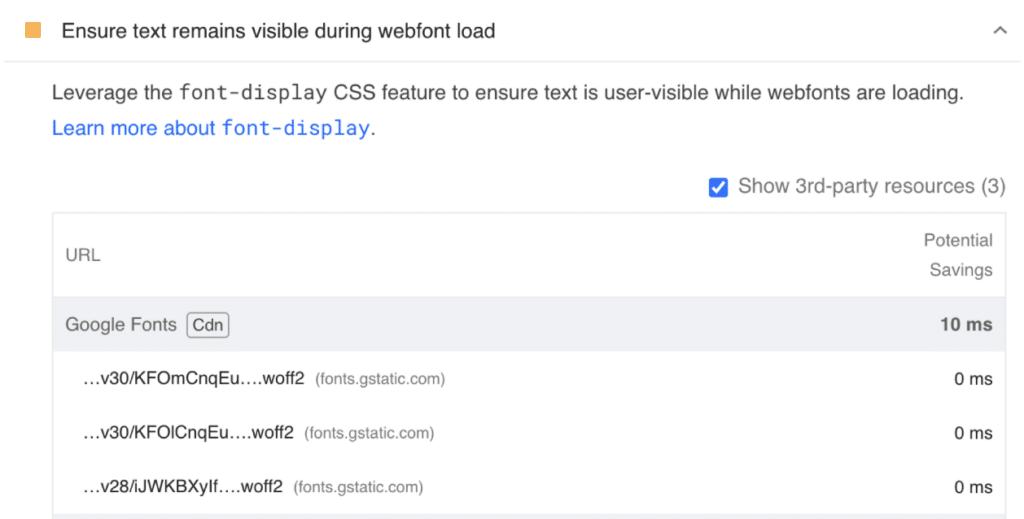
To fix this, we recommend doing a few things (can be done in Perfmatters):
- First off, you should host your Google Fonts locally for faster performance.
- Second, you should add swap to your fonts. This means there is a temporary fallback to system fonts.
- Third, you should preload the fonts to minimize any CLS. Yes, sounds counter-intuitive.
- (Optional) Fourth, you can async your Google font CSS to fix the render-blocking issue. We recommend testing on and off due to CLS.
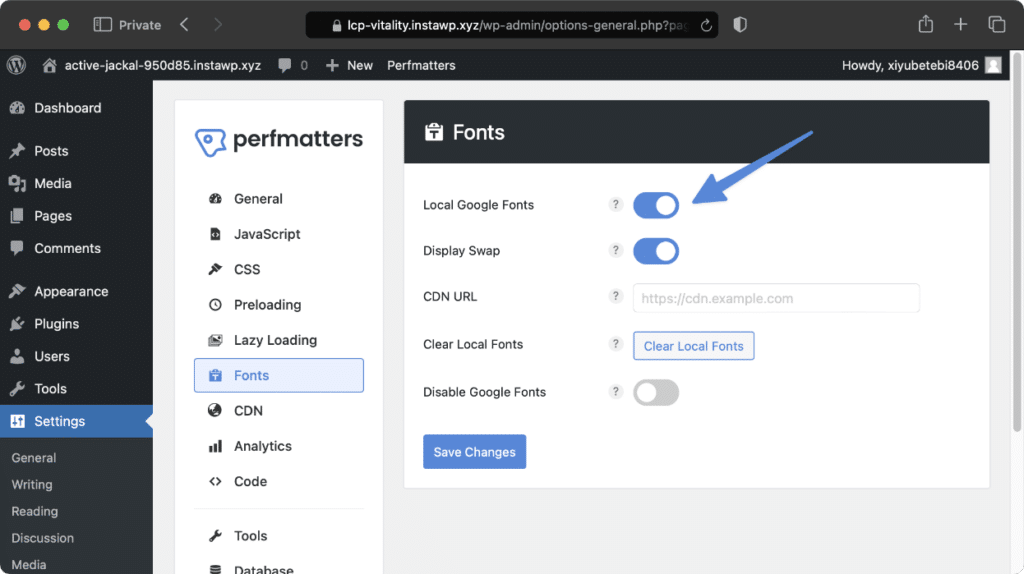
Many themes and page builders these days also allow you to upload custom fonts locally. It doesn’t matter which method you use; the important thing is to get your fonts local for better performance and privacy reasons.
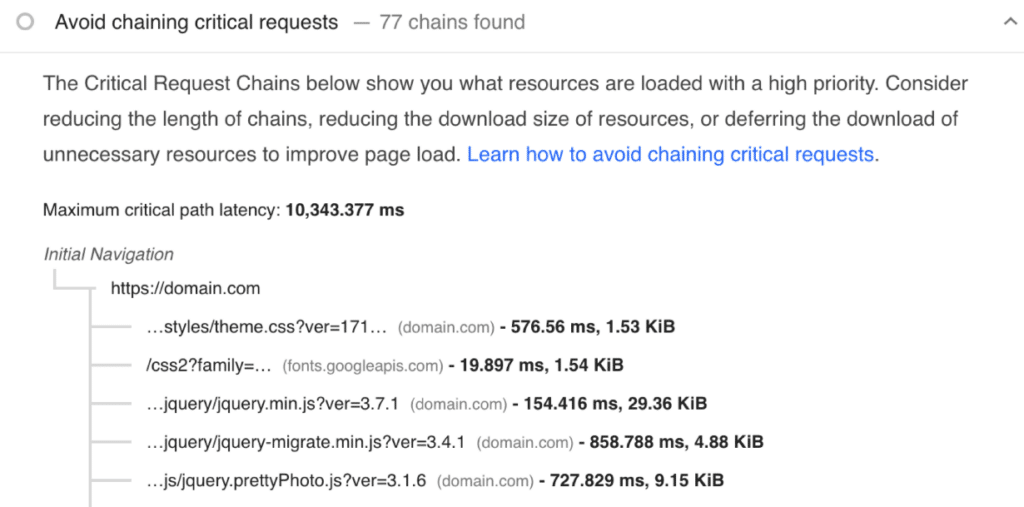
Avoid chaining critical requests
Next is the avoid chaining critical requests warning. As Google states, “the greater the length of the chains and the larger the download sizes, the more significant the impact on page load performance.” This will impact LCP.
The good news is that the other things we’ve done, such as removing unused CSS, delaying JS, deferring JS, preloading local fonts, etc., will all reduce critical requests. So by the time you get to this point, you probably won’t have much left to do. Although you could fine-tune things further with the Script Manager in Perfmatters.
Avoid enormous network payloads
Next is the “avoid enormous network payloads” warning. Essentially, this means that any large resource (JS, CSS, image, font, etc.) is going to affect the performance of your site. And this can impact your LCP.
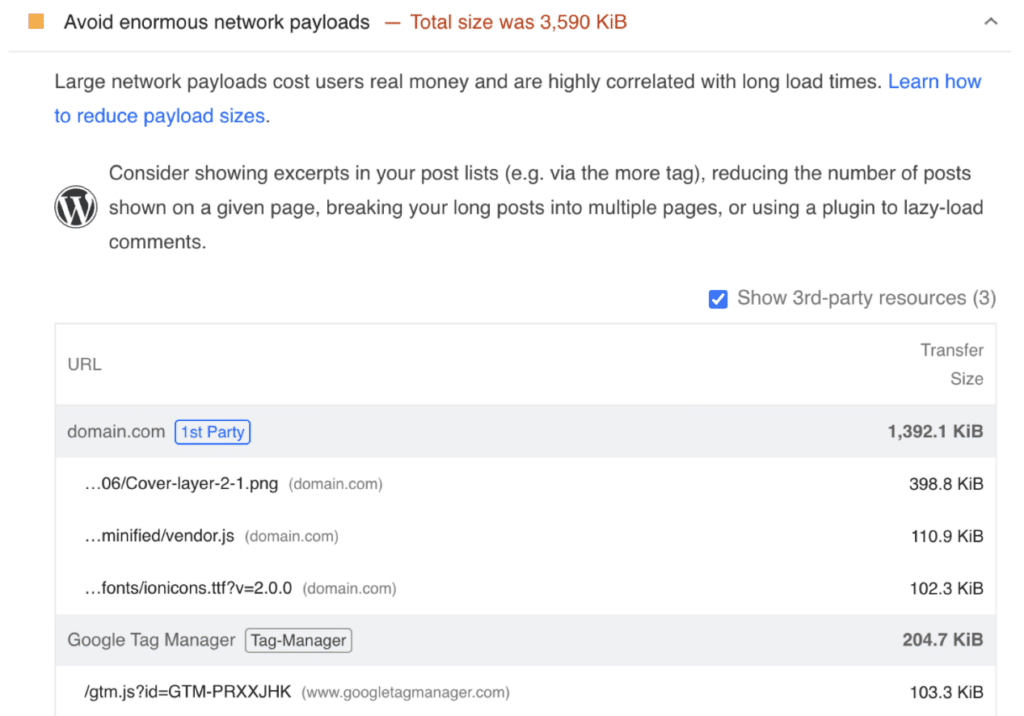
This is especially important for any assets that load above the fold. Every KB matters. A few common examples:
- Featured images or hero background images that aren’t sized or optimized properly.
- We always recommend keeping individual images at 100 KB or less, especially for mobile. You can use an image optimization plugin like ShortPixel or Imagify. The free Squoosh tool from Google is also great for fine-tuning individual images. Use WebP/AVIF formats if needed.
- Large external JS files.
- Oversized fonts. Many themes and plugins that don’t take performance into consideration might load an entire font icon library sitewide when only 1% of the library is being used (Font Awesome, Dashicons, etc.)
Font optimization
Speaking of fonts, here are a few tricks and tools we recommend to optimize them.
- Use Yellow Lab Tools to see how much of a font library is being used. For example, on this site, the client was using less than 1%.

- Use a Font Awesome kit. This lets you collect all the icons you need in a kit and then deploy that across your site, instead of all of the icons.
- Use a theme or page builder that allows you to add SVG icons individually. For example, in GenerateBlocks, you can just copy/paste SVG code from Font Awesome. Use the free SVGViewer tool’s “Optimize” feature to decrease SVG code size.
- Use Google Webfonts Helper tool to download the smallest Google Fonts with the minimum charsets. We’ve seen users decrease font sizes by 76%. (Example: Montserrat down from 64.6 KB to 15 KB)
Defer offscreen images
Speaking of network payload sizes, it’s very important that you are lazy loading every single image possible below the fold. This will fix the “Defer offscreen images” warning.
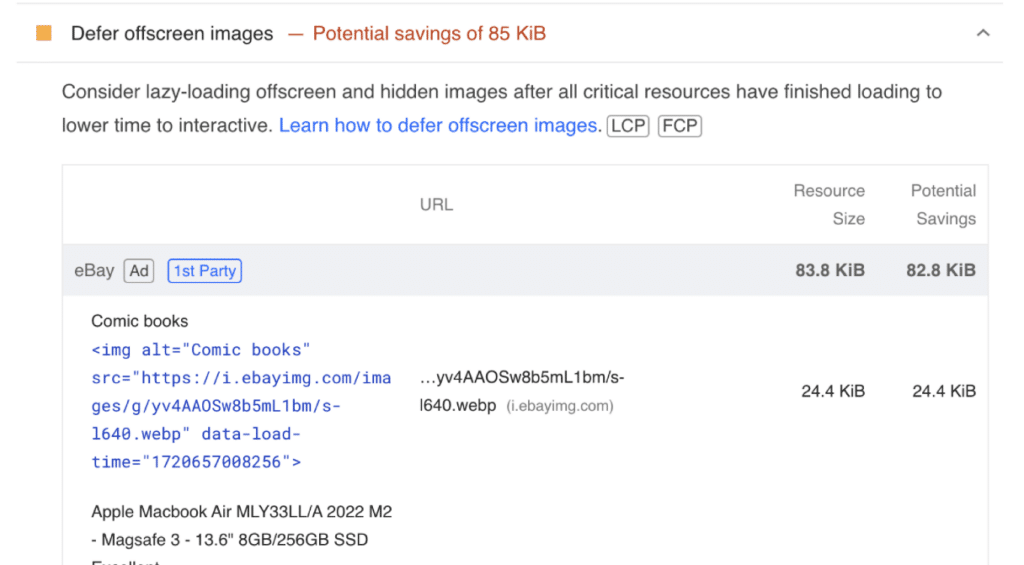
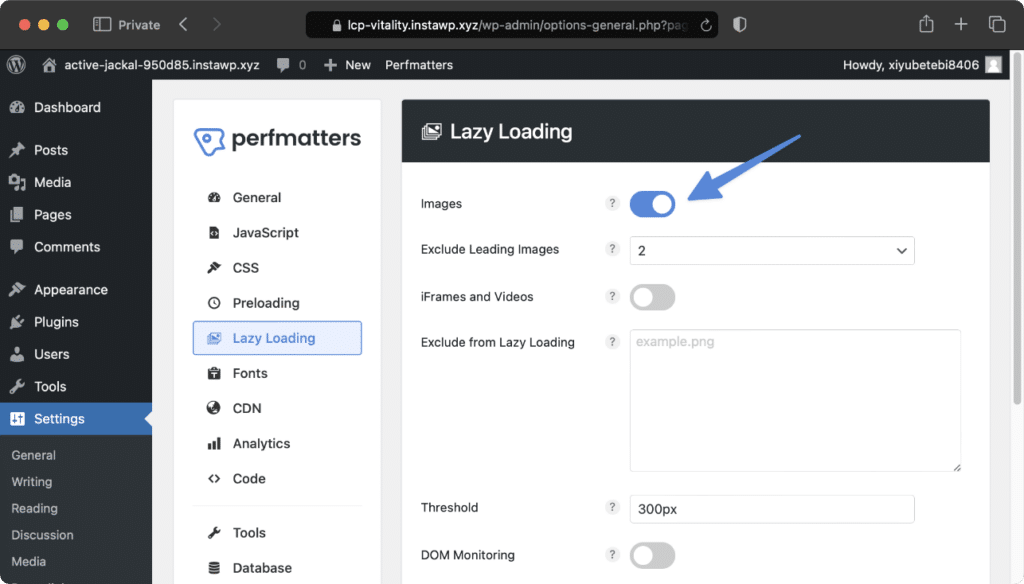
We have extensive lazy loading options in our Perfmatters plugin and filters to fine-tune things.
- Exclude leading images
- Lazy load iframes and videos (YouTube preview thumbnail feature)
- Exclusions (individual and parent selectors)
- Threshold (viewport) settings
Properly size images
Images should always be properly sized, or as close as possible. One reason is that it simply reduces the overall size of the file and reduces unnecessary data transfer. If this is your LCP element, it can definitely impact the measurement time. That is what the “Properly size images” warning is referring to.
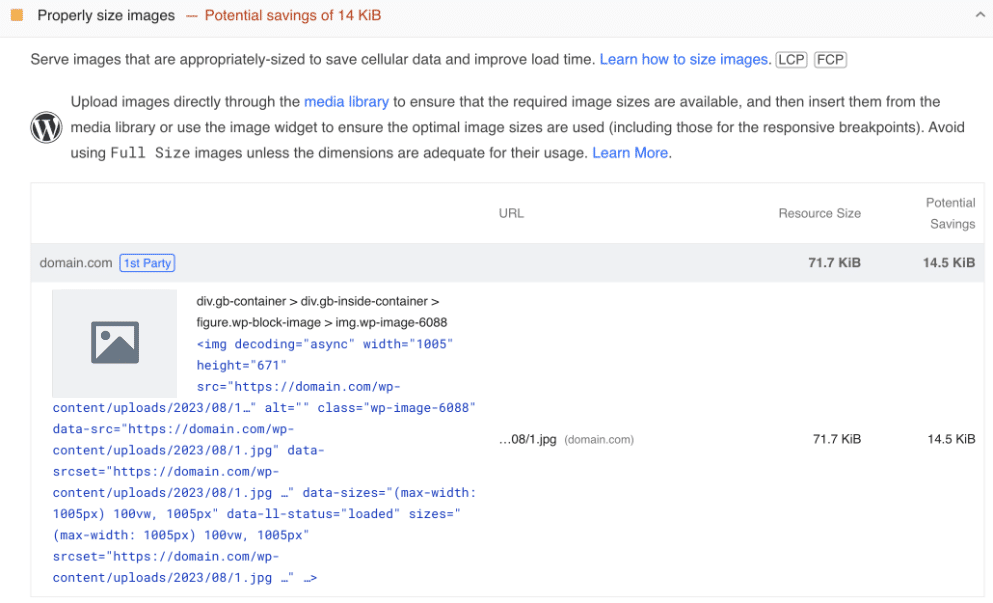
WordPress actually crops your images in the media library automatically and uses srcset for responsive images. So with many themes and page builders, you should be fine, or pretty close.
If you do see this warning a lot, you should check with your theme or page builder first to see if they have recommended sizes for the media library settings.
If you need to take it a step further, you could use a service like ShortPixel AI or EWWW to scale your images on the fly.
Optimize LCP element
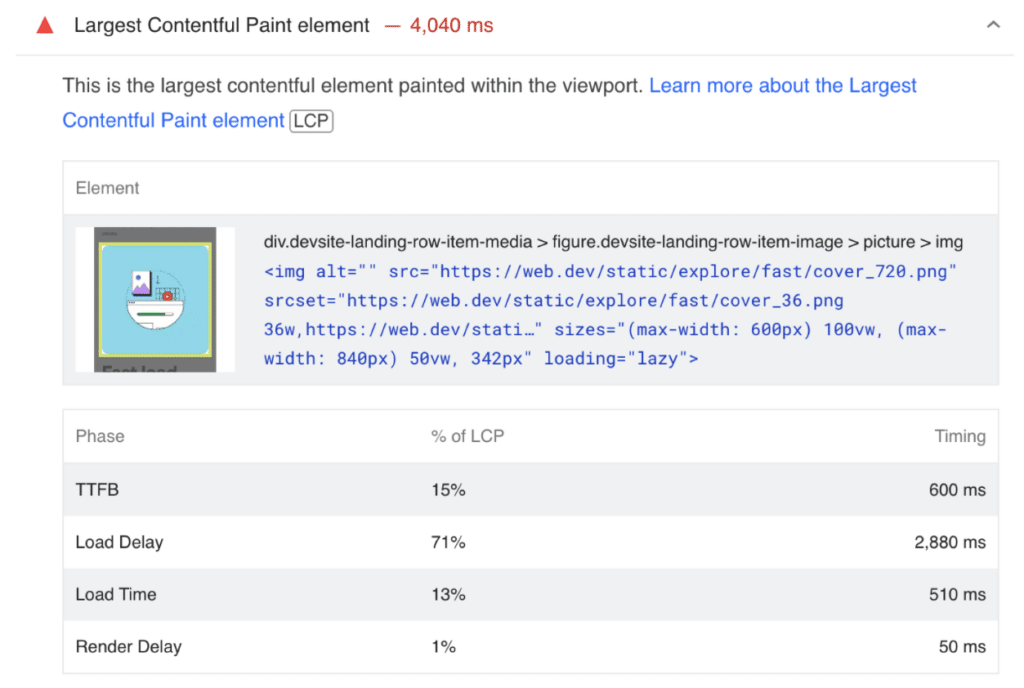
Next is the Largest Contentful Paint element. You will always have LCP, whether it’s an image, text, etc. You’re not trying to fix LCP but rather reduce the time. You want to get it within the good threshold to pass Core Web Vitals.
We like to think of optimizing LCP in two parts. The first is everything else that might impact it (what we just went over), and the second is the LCP element itself.
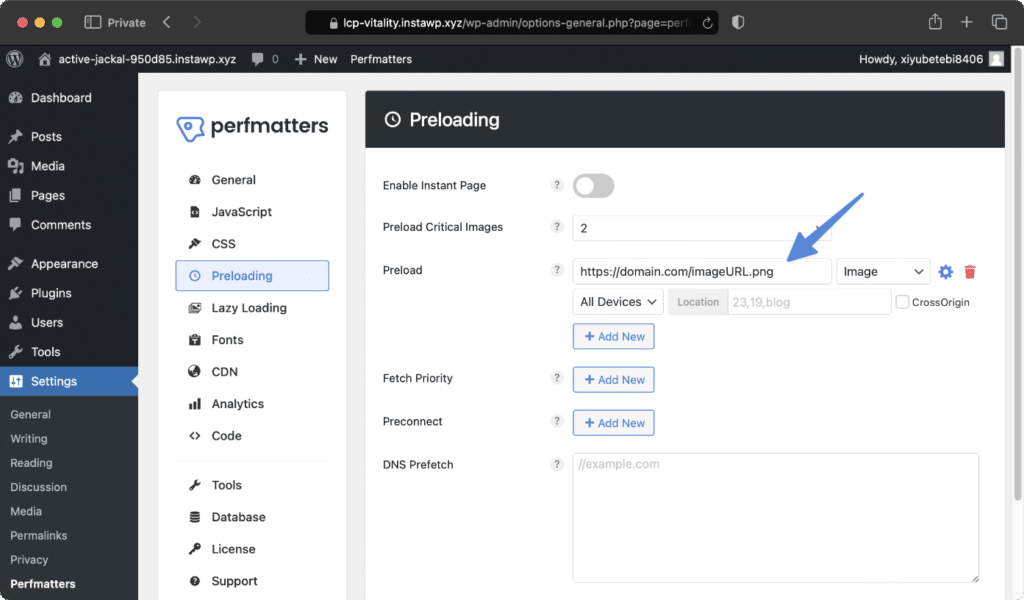
The first thing we recommend doing is enabling is to enable preload critical images in our Perfmatters plugin. That will preload images, starting with those first in the HTML. Essentially this forces the image to load as soon as possible, moving it to the top of the waterfall.
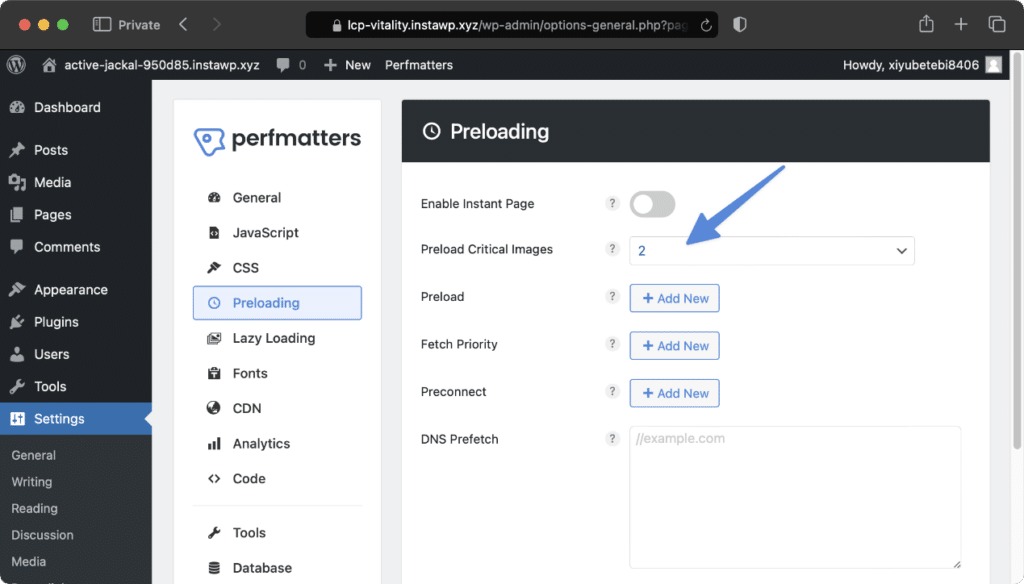
We have extensive filters for preloads. You can exclude individual images, exclude where certain preloads are added, and also exclusions by parent classes. For example, let’s say you have a mega menu running with a few images that might still be in the viewport or HTML. You could exclude their parent class. You can really fine-tune what is and isn’t preloaded as needed.
What about background hero images in CSS? You can still preload these manually if needed using our individual preload feature. You can choose a location for where you want that image to load and separate preloads per device (mobile/desktop) if needed.
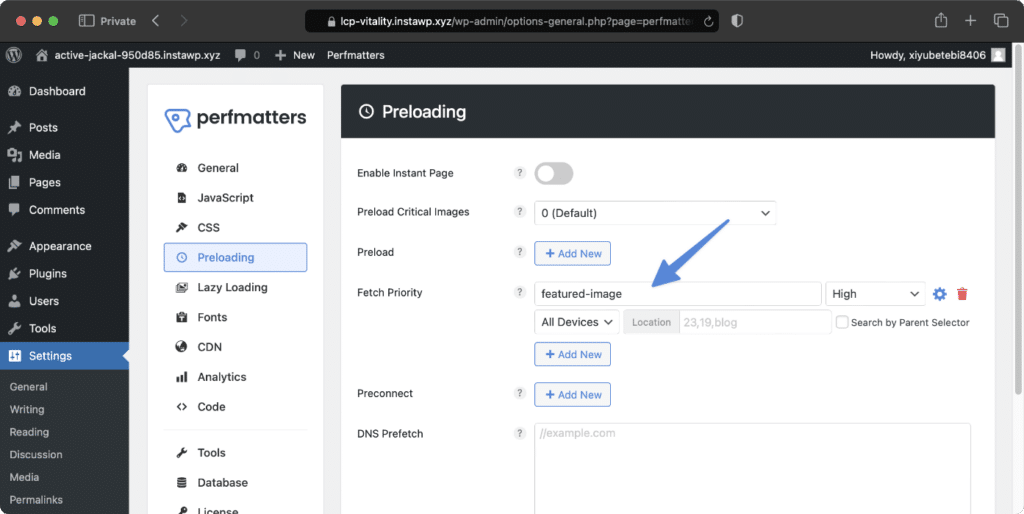
Another alternative or something to use alongside preloading is fetch priority. This is a hint to tell the browser that the resource should have a higher priority. Think of it like preloading, but less powerful.
The latest versions of WordPress actually add fetch automatically. However, we’ve found this isn’t very accurate, and many times it will add fetch to the wrong image (below the fold). So we added a Disable Core Fetch option in Perfmatters. We might remove this if they improve core later down the road.
You can then fine-tune things better in Perfmatters. Add fetch on <img>, <link>, and <script> tags and assign a priority of high or low. You can also use parent selectors if something doesn’t have a unique class on it.
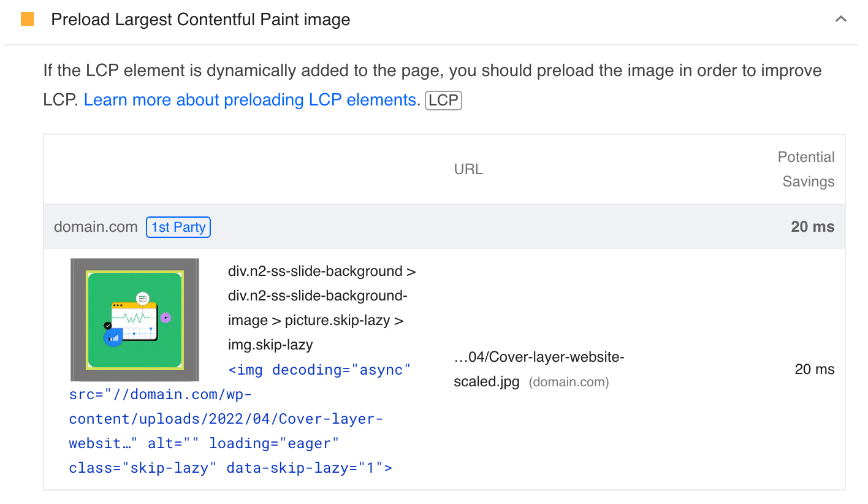
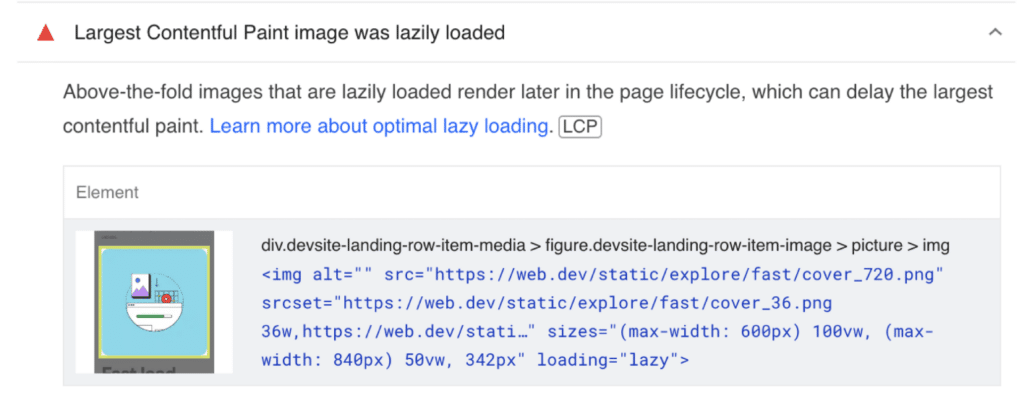
After you’ve preloaded your LCP image, or utilized fetch priority, you want to make sure they are excluded from lazy loading. You never want to lazy load your LCP element.
The good news is that we automatically exclude images from lazy loading that are using our preload critical image feature and fetch priority. This will prevent the “Largest Contentful Paint image was lazy loaded” warning from occurring in PageSpeed Insights.
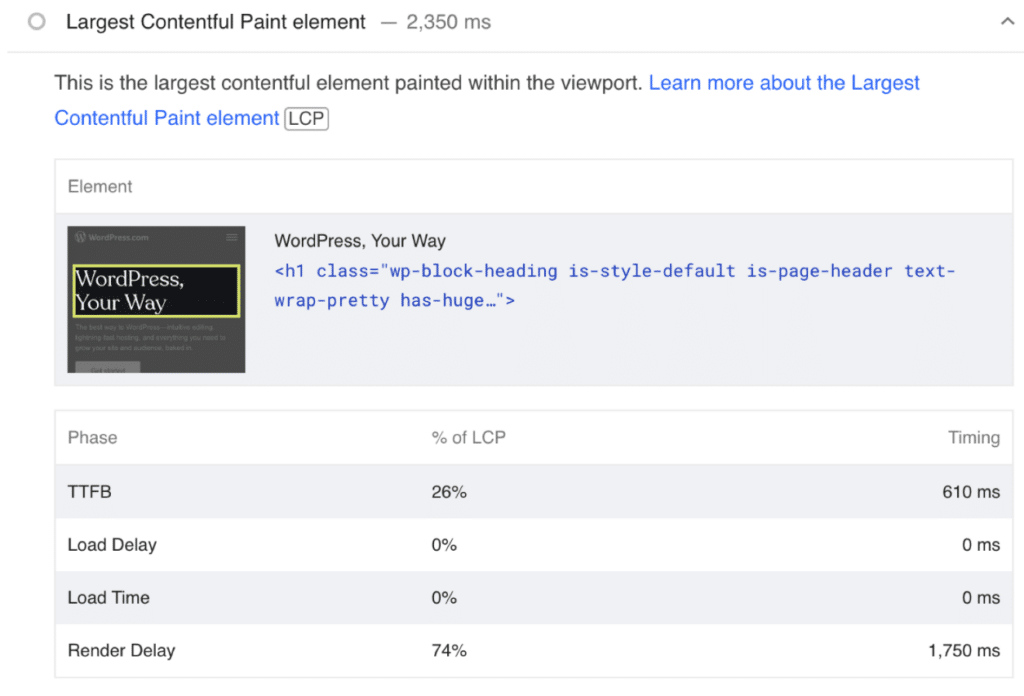
Another little trick I’ve seen folks doing is purposely making the LCP element text/header. You don’t always necessarily need a large image above the fold. But remember, an image is only part of what impacts LCP.
Disable plugins (CSS/JS)
Another way to improve LCP is to ensure that the scripts and CSS from plugins and themes aren’t loading where they shouldn’t.
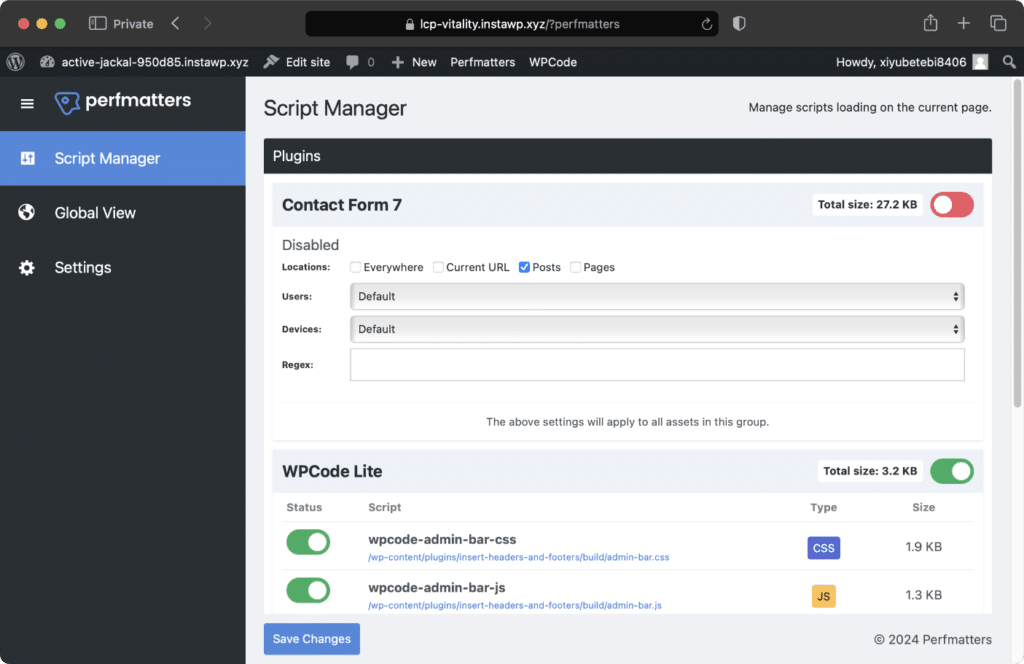
The Script Manager in Perfmatters allows you to disable scripts on a per post/page basis or sitewide basis. And MU mode lets you disable entire plugins from running (MySQL queries, inline code, etc.).
This can be very powerful, but it is also a more advanced feature. For many users just starting out, we recommend starting with the other optimizations first (which are more automated) and then fine-tuning with the Script Manager at the end.
Speculative loading techniques
Not everything is about final page speed scores or tests. You always need to think about the user experience and perceived performance (how fast a site feels, quick to navigate, etc.). There are different speculative loading mechanisms you can use. This will help drastically improve LCP for the user as they navigate your site.
- Preconnect allows the browser to set up early connections before an HTTP request, eliminating round-trip latency and saving time for users (DNS + TCP + TLS). This is great for third-party requests that might not already be delayed, or a CDN URL (cdn.domain.com). We have a preconnect feature in Perfmatters.
- Prefetch lets you automatically fetch most of the resources required to render a URL in the background after a user hovers over a link. This results in faster load times and navigation. WordPress 6.8 and higher now has prefetch built in with Speculative Loading.
- Prerender goes a step further than prefetch, and actually renders the entire page (or parts of it) in the background after a user hovers over a link, including executing JavaScript and rendering the DOM. This results in pretty much instant load times. You can enable prerender in WordPress 6.8 and higher using our Speculative Loading options in Perfmatters. We use prerender on all of our sites.
Early Hints
Early Hints (HTTP 103) allows a server to send preliminary instructions to a browser before the full page response is ready, utilizing the server’s “thinking time.” This enables the browser to fetch resources early (images, CSS, JS), leading to significant performance gains. Cloudflare, for instance, reported a 30% improvement in LCP, and Shopify saw a 500ms faster LCP.
If you’re using Cloudflare on your WordPress site, you can utilize Early Hints alongside your Perfmatters preloads. Choose which types of resources you want this on, such as fonts, images, scripts, or styles.
