
Interaction to Next Paint (INP) is a Core Web Vitals metric introduced on March 12, 2024. It’s definitely one of the trickier and more frustrating metrics to fix, as one of the most significant factors can simply be the code quality underneath your site. This is where moving to lightweight plugins and themes can really come into play. However, third-party scripts also play a huge part, as these tend to be a big contributor to blocking the main thread (TBT), which goes hand in hand with INP.
- What is Interaction to Next Paint?
- How to measure Interaction to Next Paint
- How to optimize Interaction to Next Paint
- Additional resources
What is Interaction to Next Paint?
Google continuously collects data on how your website behaves. This real-user data is what you see at the top of speed tests in PageSpeed Insights. Interaction to Next Paint (INP) is a Core Web Vitals metric that Google uses to measure how quickly your website reacts to user interactions, reporting the longest duration. It replaces the First Input Delay (FID) metric. Only INP, LCP, and CLS are official metrics that you must pass or fail. Every other metric is a notable metric, something that might impact them.
A common example we like to use to understand INP is the mobile menu on your WordPress site. Google measures how much time it takes from keypress to fully opening (or how long the visual update takes) the menu. This can be any type of element, even just a link, but typically the slowest offenders will be interactive elements that consume more time, such as a search box, accordion, popup, slider, etc.
According to Barry Pollard, a Web Performance Developer Advocate at Google Chrome, INP is not (necessarily) measured up until the next full page load displays content, but only up until the main thread is no longer being blocked.
Google is looking at mouse clicks, taps on a screen, and key presses. Interactions not measured are scrolling and hovering.
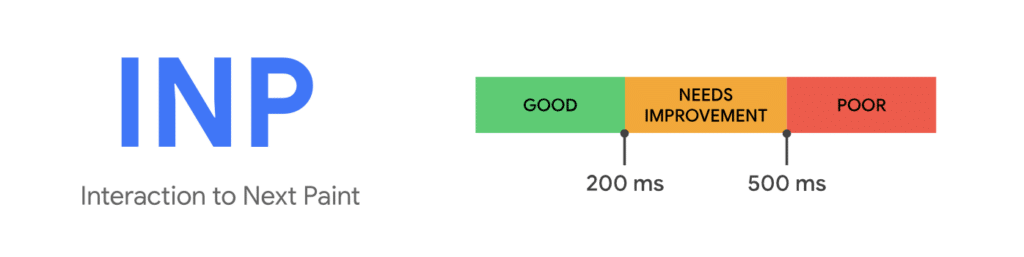
To meet the threshold for Google and provide a good user experience, the INP should be 200 ms or less. If you’re under that, you’ll be “good” and in the green. Google will flag anything between 200 ms and 500 ms as “needs improvement” and over 500 ms as “poor.” Google reports the 75th percentile of user experiences. Or rather, the INP that is reported is the slowest 25%.
INP is all about the user experience. Lowering the INP should result in it feeling faster (perceived performance) when navigating around a site.
How to measure Interaction to Next Paint
INP can be measured with several different tools, including those from Google and third parties. In fact, some of the third-party ones can be more helpful.
PageSpeed Insights
The first tool you can use is Google PageSpeed Insights. However, there are some important things to remember when interpreting the results.
- Unlike other metrics (LCP, FCP, CLS, etc.), there is no lab data for INP, only real-user data. Why? INP requires data from multiple user interactions on the page to determine the longest INP duration. Therefore, there is no single instance of lab data that would really be helpful or applicable.
- The data at the top of the tests shows real-user data. This is computed from the Core Web Vitals metrics over a 28-day collection period. This is not live data, but it’s really the only metrics that matter. It’s what you pass or fail on, not lab data.
- There is a tab at the top right which contains different data for the following:
- This URL: The URL you’re currently testing.
- Origin: An average across the entire site when there isn’t enough data for the URL. On sites with lower traffic, it will often default to Origin.

INP Debugger
The next tool we’re big fans of is DebugBear’s free INP Debugger. This won’t pick up everything, as it’s kind of a one off test (with a few clicks). It’s not the same as real-user data over time. However, it can be an easy way to test INP on your WordPress site and quickly identify the UI elements that are causing the slowest user interactions.

In this example, on our own website, they detected our cookie prompt and mobile menu as some of the slowest UI interactions. This makes perfect sense, as these are really the only moving elements we have. They also measured interactions on some of our links, but these were much quicker, between 10-20 ms.

Google Search Console
Google Search Console is a tool you should have hooked up for every WordPress site you run. It’s a great way to get notifications on URLs that need improvement, such as those perhaps needing some work when it comes to INP.
You can also use Google’s CrUX Dashboard to get a great overview of your INP data over a period of time. This is assuming your site has CrUX data available.

Chrome Devtools
There are a couple of different methods you can use in Chrome Devtools to measure and see INP metrics.
1. You can use the performance tab in Chrome 129+ which lets you monitor live data versus real-user data. See tutorial. The Chrome team is also working to add more data, such as sub-part times (the three components) and script attribution for INP.

2. You can run local INP measurements with Lighthouse. Click on the “Lighthouse” tab. Select “Timespan” and then click on “Start timespan.”

Click around your site, interact with dynamic elements, visit multiple pages, etc. Once the report is generated, scroll down to the “Minimizes work during key interaction” section. This will include different scripts, elements, etc., that were impacting INP.

However, remember, it’s only measuring what you interacted with. But it can be another way to spot what might be increasing your INP time.
3. You can run a recording trace and import it into a nifty tool like Perflab, which is designed to make reading traces easier.
If you really want to dive into the nitty-gritty of INP measurement in Chrome Devtools, we highly recommend watching these presentions:
- Optimizing INP: A deep dive from Chrome for Developers
- New field insights for debugging INP from Jeremy Wagner
- Interaction to Next Paint from Annie Sullivan
Real user monitoring (RUM) tools
RUM tools are by far the best way to track down INP. Basically, you install the tool (script) on your site and let it continuously monitor all the interactions over a period of time. This essentially will more closely mimic the real-user data you’re seeing in PageSpeed Insights because it’s tracking everything, not just a looking at single interaction that may or may not be the issue.
Many of these utilize the Long Animation Frames (LoAF) API which can help identity exactly which scripts are contributing to rendering delays. And because they have so much data gathered from your site, they will also usually let you drill down into the specific elements and actions.
Here are a few RUM tools that can help monitor INP and then debug it:
- DebugBear (docs)
- SpeedCurve (docs)
- SpeedVitals (free 1-site plan, paid plans for more sites/traffic)

- Request Metrics (docs)
- DebugHawk (14-day free trial)
- New Relic (docs)
- Cloudflare (docs, very basic still with no individual INP elements yet, however it’s most likely coming)

Debugbear is by far one of our favorite tools. They also have a 14-day free trial (no credit card required), so you can give it a try first to see if it helps track down your issue. You’ll get more data with this tool than any of the other methods.

A few things Debugbear can help you find:
- Quickly spot the worst URL offenders.
- Primary domains causing the INP. If it’s coming from a third-party script or ad network like Mediavine, Raptive, etc., this is super handy.
- Identify specific user interactions that are slow by looking at what page element the user interacted with.
- Breakdown of INP by elements in a table.
- Breakdown of your worst INP by element type (links, images, buttons, content, etc.)

How to optimize Interaction to Next Paint
When it comes to optimizing INP, almost everything depends on how much JavaScript and CPU time is involved with your user interactions on elements. The slowest ones will hurt you the most. CSS can also be responsible, but in our experience, it’s almost always JavaScript. And that means it’s important to first understand total blocking time (TBT), as they go hand in hand.
TBT is a metric that measures how long the main thread of a webpage is blocked during the longest period of time when the page is loading.
Imagine your webpage as a busy chef (main thread). When it’s cooking (loading), it sometimes needs to focus on a task for a while (long task: over 50 ms). During this time, it can’t take new orders from customers (user interactions).
TBT measures how long the chef is too busy to take orders during the most critical phase when customers (users) are waiting to interact with the menu (the webpage).

TBT is classified as a notable metric. It’s not an official Core Web Vitals metric. Only INP, LCP, and CLS are official metrics that you must pass or fail. Why is it important? The goal is to minimize this time so that the webpage feels responsive. If TBT is too high, it means users have to wait too long before they can click, scroll, or type.
TBT impact on INP and thresholds
How does TBT impact INP? If a user interacts with a page during a period where the main thread is blocked (as measured by TBT), the browser will need to wait for these long tasks to finish before it can process the interaction and update the UI.
- Delayed Processing: The longer the main thread is blocked, the more likely it is that user interactions will have to wait, increasing the time before the next visual update can occur.
- Visual Feedback: INP includes not just the input delay but also the time for the next paint, which provides visual feedback to the user. High TBT can result in a high INP because the browser might not be able to paint the next frame promptly, making interactions feel sluggish.
Imagine clicking a button that should change color immediately but also trigger a complex operation. If the main thread is blocked by TBT at that moment, the color change (part of INP) could be noticeably delayed, leading to a poor user experience.
Minimizing TBT is incredibly important for reducing delays in INP, ensuring that when a user interacts with your webpage, they receive prompt visual feedback.
According to Google, they want you to have a TBT of 200 ms or less. It accounts for 30% of the score.

Reduce JavaScript execution time
The first thing you can do to improve TBT/INP is to reduce JavaScript execution time. You can use a feature like Delay JavaScript in our Perfmatters plugin. You can see the massive TBT difference below.
Before Delay JS

After Delay JS

Remember, INP can be measured at any point, so delaying JS isn’t necessarily always helping with that. But the goal is to get the TBT down as much as possible regardless.
Minimize main-thread work
There are multiple things you can do to minimize the main-thread work.
- Delay JavaScript on user interaction
- Minify JavaScript
- Minify CSS
- Remove unused CSS
- Disable plugins that shouldn’t be loading sitewide (Script Manager)
All of these things can be done in our Perfmatters plugin. And remember it’s important to keep your HTML doc size as small as possible too. Not everything always needs to be inline.
Before optimizations

After optimizations

Avoid long main-thread tasks
For long main-thread tasks, you can again utilize the Delay JS feature in Perfmatters. We also really like using Debugbear for this. For example, you can see third-party CPU time and hover over long task durations to see the contributing URL. It’s great for troubleshooting third-party scripts that might be causing long main-thread tasks.

They also have a list of the CPU time by request. You can easily see all third-party domains/scripts adding to your CPU time. WebPageTest and Third Party Explorer are also handy to analyze CPU time.

Before Delay JS

After Delay JS

Reduce the impact of third-party code
For third-party code, one of the best options you have is to either remove it or delay it on user interaction. Unfortunately, there might not always be a quick fix or way to optimize the code itself.
Many sites that are running ad networks like Google Adsense, Raptive (AdThrive), BlogHer, Mediavine, etc., typically have higher TBT and then in turn worse INP. In fact, we’ve seen higher INP on every ad network site we’ve worked on.
Also, remember that while delaying JS on user interaction might help resolve some of the TBT, it might not always fix INP issues, as this can be measured at any point in the load. Or rather, don’t think of Delay JS as a quick fix for INP related issues.
Before Delay JS

After Delay JS

Avoid an excessive DOM size
What can you do to decrease the HTML doc size and reduce the number of DOM elements? Here are a few quick pointers.
- One obvious solution is to consider the length of your pages. Instead of adding 5 rows of products on a WooCommerce site homepage, perhaps cut that back to 2 or 3 rows. That will reduce the DOM/number of elements.
- We can’t stress enough how important it is to use lightweight themes and plugins that were built with performance in mind from the ground up. The quality of the code you’re running matters. Even a small component, such as an accordion coded in the wrong way, can impact INP.
- For building and designing your site, we recommend the following combinations:
- GeneratePress and GenerateBlocks
- Kadence and Kadence Blocks
- Bricks
- Shoptimizer (if you’re running WooCommerce)
- For building and designing your site, we recommend the following combinations:
- Don’t just inline everything possible. We see a lot of tendency to just inline all the CSS, and this can easily lead to a really large HTML doc. Using external stylesheets allows them to be cached separately. The same goes for inline SVG code. Remember, with SVGs as an image, you can lazy load them.
- You can utilize the Script Manager in Perfmatters to disable scripts, stylesheets, or entire plugins where they might not be needed or shouldn’t be loaded. MU mode includes inline CSS/JS.
- Pay attention to the number of HTML elements on your pages or posts. For example, we were working with a client who didn’t realize they had thousands of spam comments. This quickly added up to over 60,000 DOM elements on a single post and page size of over 700 KB.
We also have a feature in our Perfmatters plugin called Lazy Elements.
The more HTML elements you have, typically, the more time is spent, leading to higher TBT. It can be a tricky thing to optimize in WordPress as you can’t just remove DOM elements, which make up the structure of a page. However, you can lazy load selective elements. Think of it just like lazy loading an image below the fold, in this case, you can lazy load an element chain below the fold, reducing the overall DOM size.
Before Lazy Elements

After Lazy Elements

Disable Click Delay in Perfmatters
When it comes to Perfmatters specifically, if you’re using our Delay All Scripts feature, we recommend using our advanced Disable Click Delay option.
When you delay JavaScript, the click delay might be longer than desired if you have a large and complex site with a lot of JavaScript. Take your mobile menu, for example. Based on how your theme or page builder is coded, it might have to wait for all of the JavaScript to load before it opens. Therefore, disabling the click delay can help speed things up and prevent it from having a negative impact on INP.
For the Disable Click Delay feature to work properly, it requires that you have all the proper JavaScript exclusions in place. Make sure to take advantage of our quick exclusions. We’re always adding new ones to help streamline this process. But if you run into any issues, we’re happy to help.
Here are the steps to disable the click delay.
Step 1
Toggle on “Show Advanced Options” in Perfmatters.
Step 2
In the JavaScript section of Perfmatters, scroll down and toggle on “Disable Click Delay.”

Step 3
Scroll down and click “Save Changes.”
And of course, using the Script Manager to ensure scripts only load when they are needed is also important.
Speculative loading
Speculative Loading can help improve INP by proactively handling resource fetching, parsing, or rendering tasks before the interaction, so the browser can produce the next paint more quickly after the interaction. It’s particularly effective for navigation or resource-dependent interactions.
Speculative Loading was added to WordPress core in version 6.8. So it’s automatically already running behind the scenes. However, it defaults to prefetch mode. For the best results and most significant impact on lowering INP, we recommend using prerender mode. You can enable prerender mode using Perfmatters.
Other optimization tips
Here are a few additional tips on things that might impact INP:
- Having more dynamic elements can easily hurt you. Always avoid things like animations, sliders, popups, whenever they aren’t absolutely necessary.
- It’s important to reduce the size of the DOM when you can.
- We’ve seen a big correlation with high total blocking time (TBT) resulting in higher INP values. So sometimes it can help to track down the biggest contributors to TBT. Many sites that are running ad networks like Google Adsense, Raptive (AdThrive), BlogHer, Mediavine, etc., typically have higher TBT. We recommend reaching out to them to see what they are doing to best optimize for INP.
- Try to minimize the time consumed by the main thread.
- If you’re running a lot of third-party scripts, one way to reduce the main thread is to utilize a tool from Cloudflare like Zaraz to offload the JavaScript entirely to the edge.
- We recommend turning off Cloudflare Rocket Loader.
INP is frankly one of the hardest metrics for an optimization plugin to help with since it can’t fix the underlying code that still has to run at some point (specifically tied to that user interaction). However, we’ll keep updating this doc with tips and suggestions as INP evolves.
Additional resources and case studies
- Why does Lighthouse not include the INP metric?
- Optimizing Interaction To Next Paint (step-by-step guide)
- INP interactive demo
- Debunking 5 myths about INP (video)
- What is an AnimationFrame and what can it tell you?
- Optimize Interaction to Next Paint
- Google Codelabs on understanding Interaction to Next Paint
- Optimizing INP for a React app & performance learnings
- How Taboola used LoAF to improve INP up to 36%
- How Trendyol reduced INP by 50%, resulting in a 1% uplift on CTR
- INP changelog
